Monitoring Juno 📊
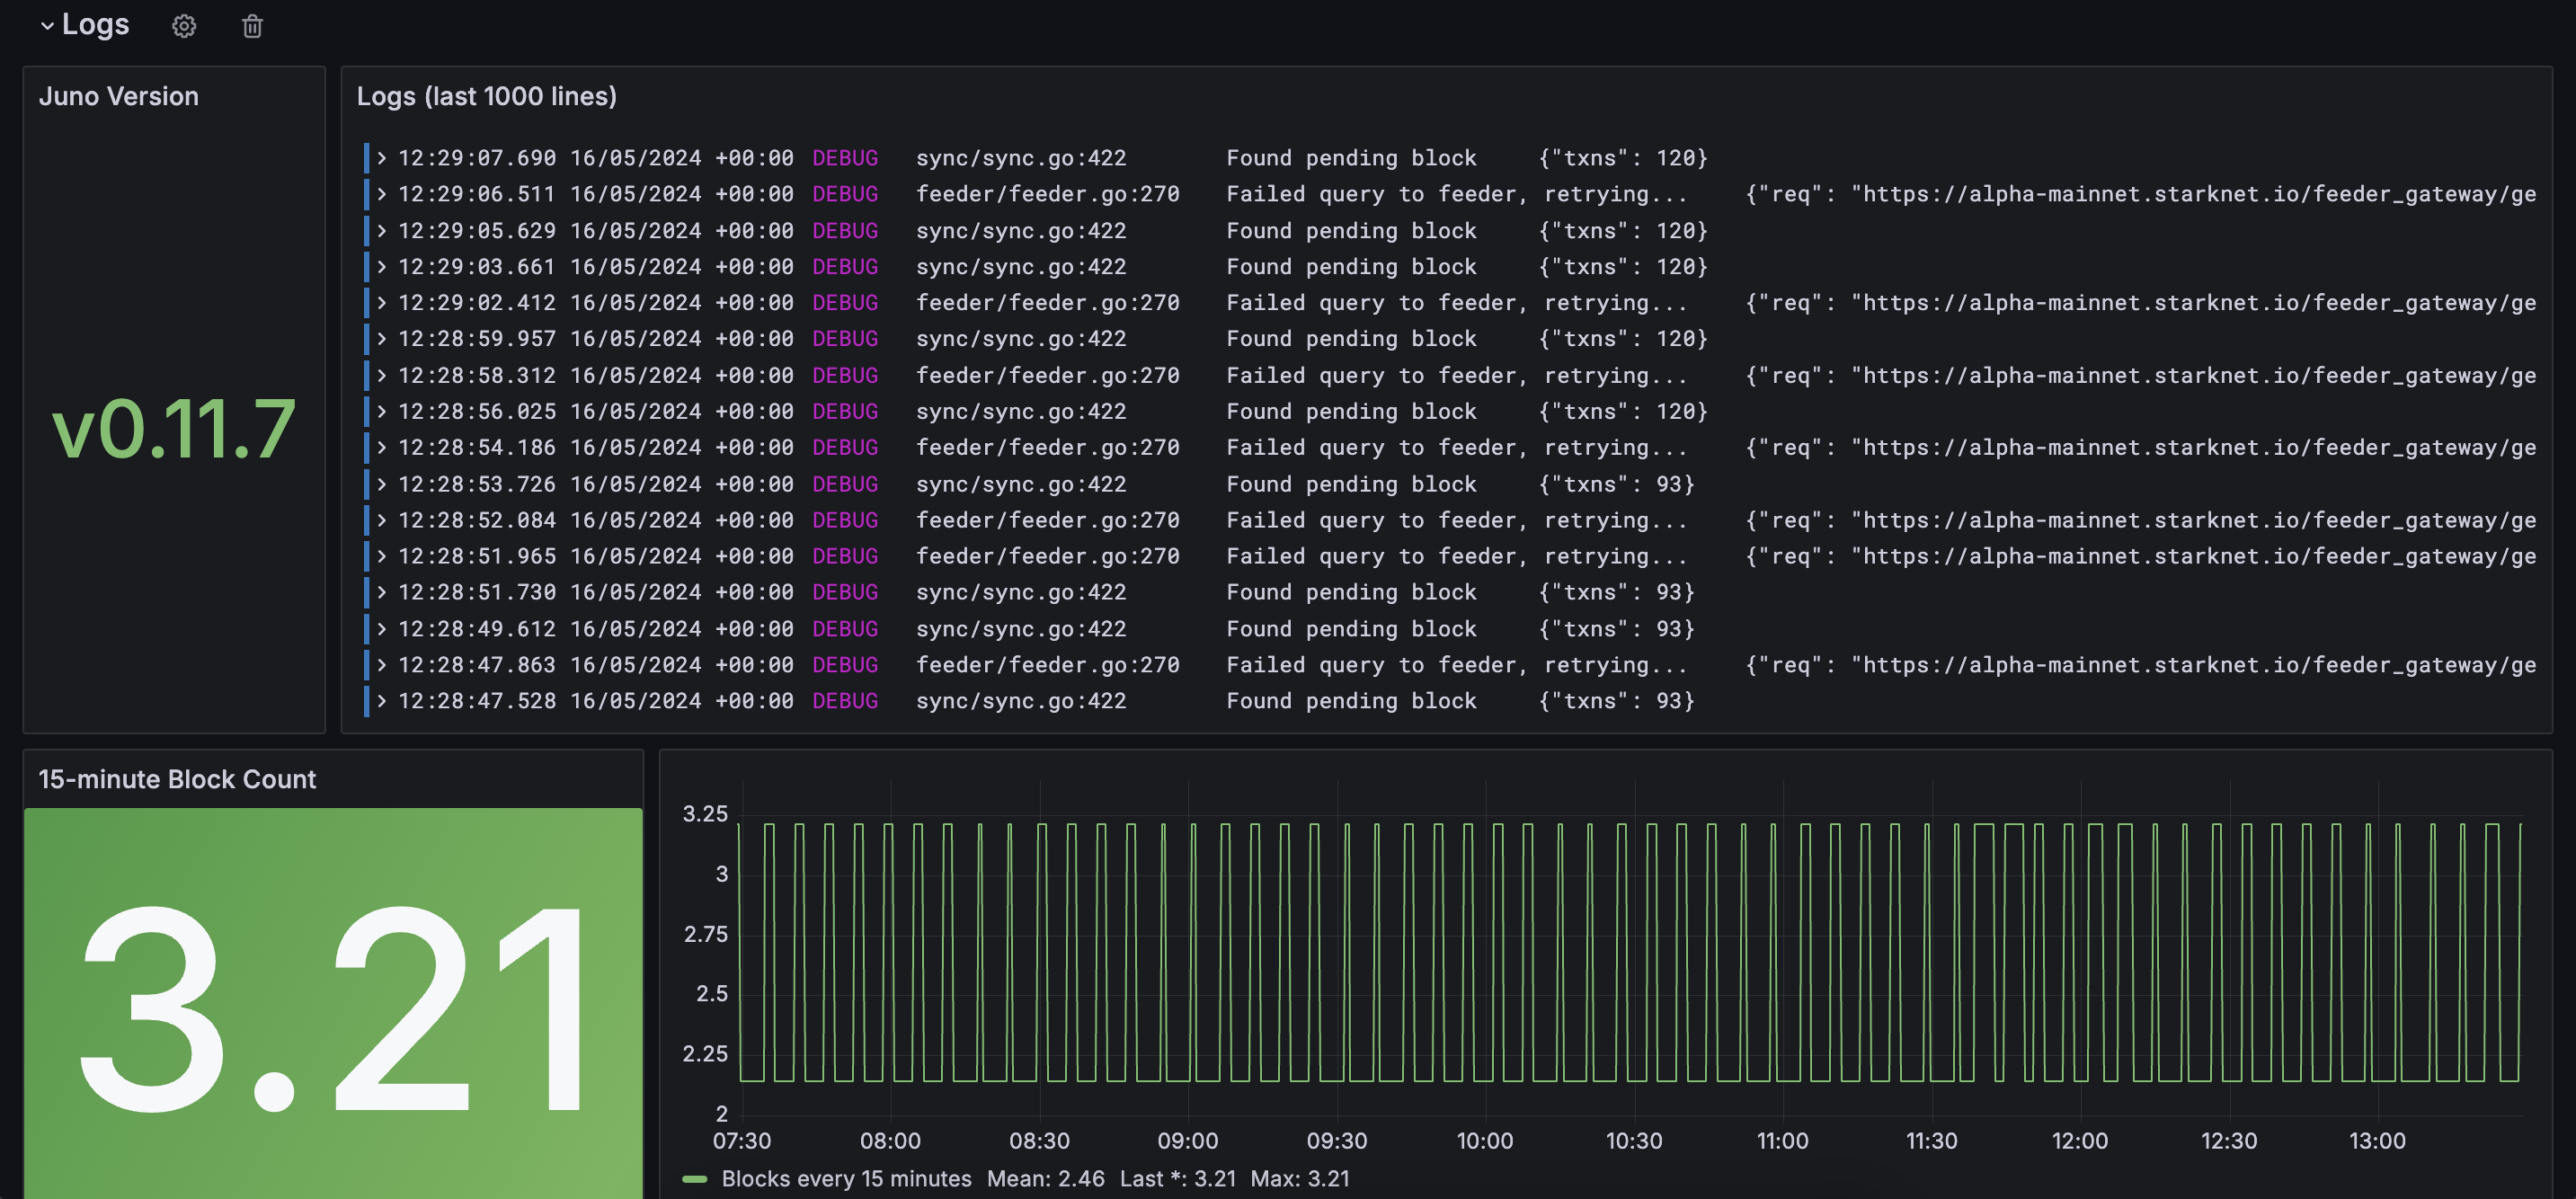
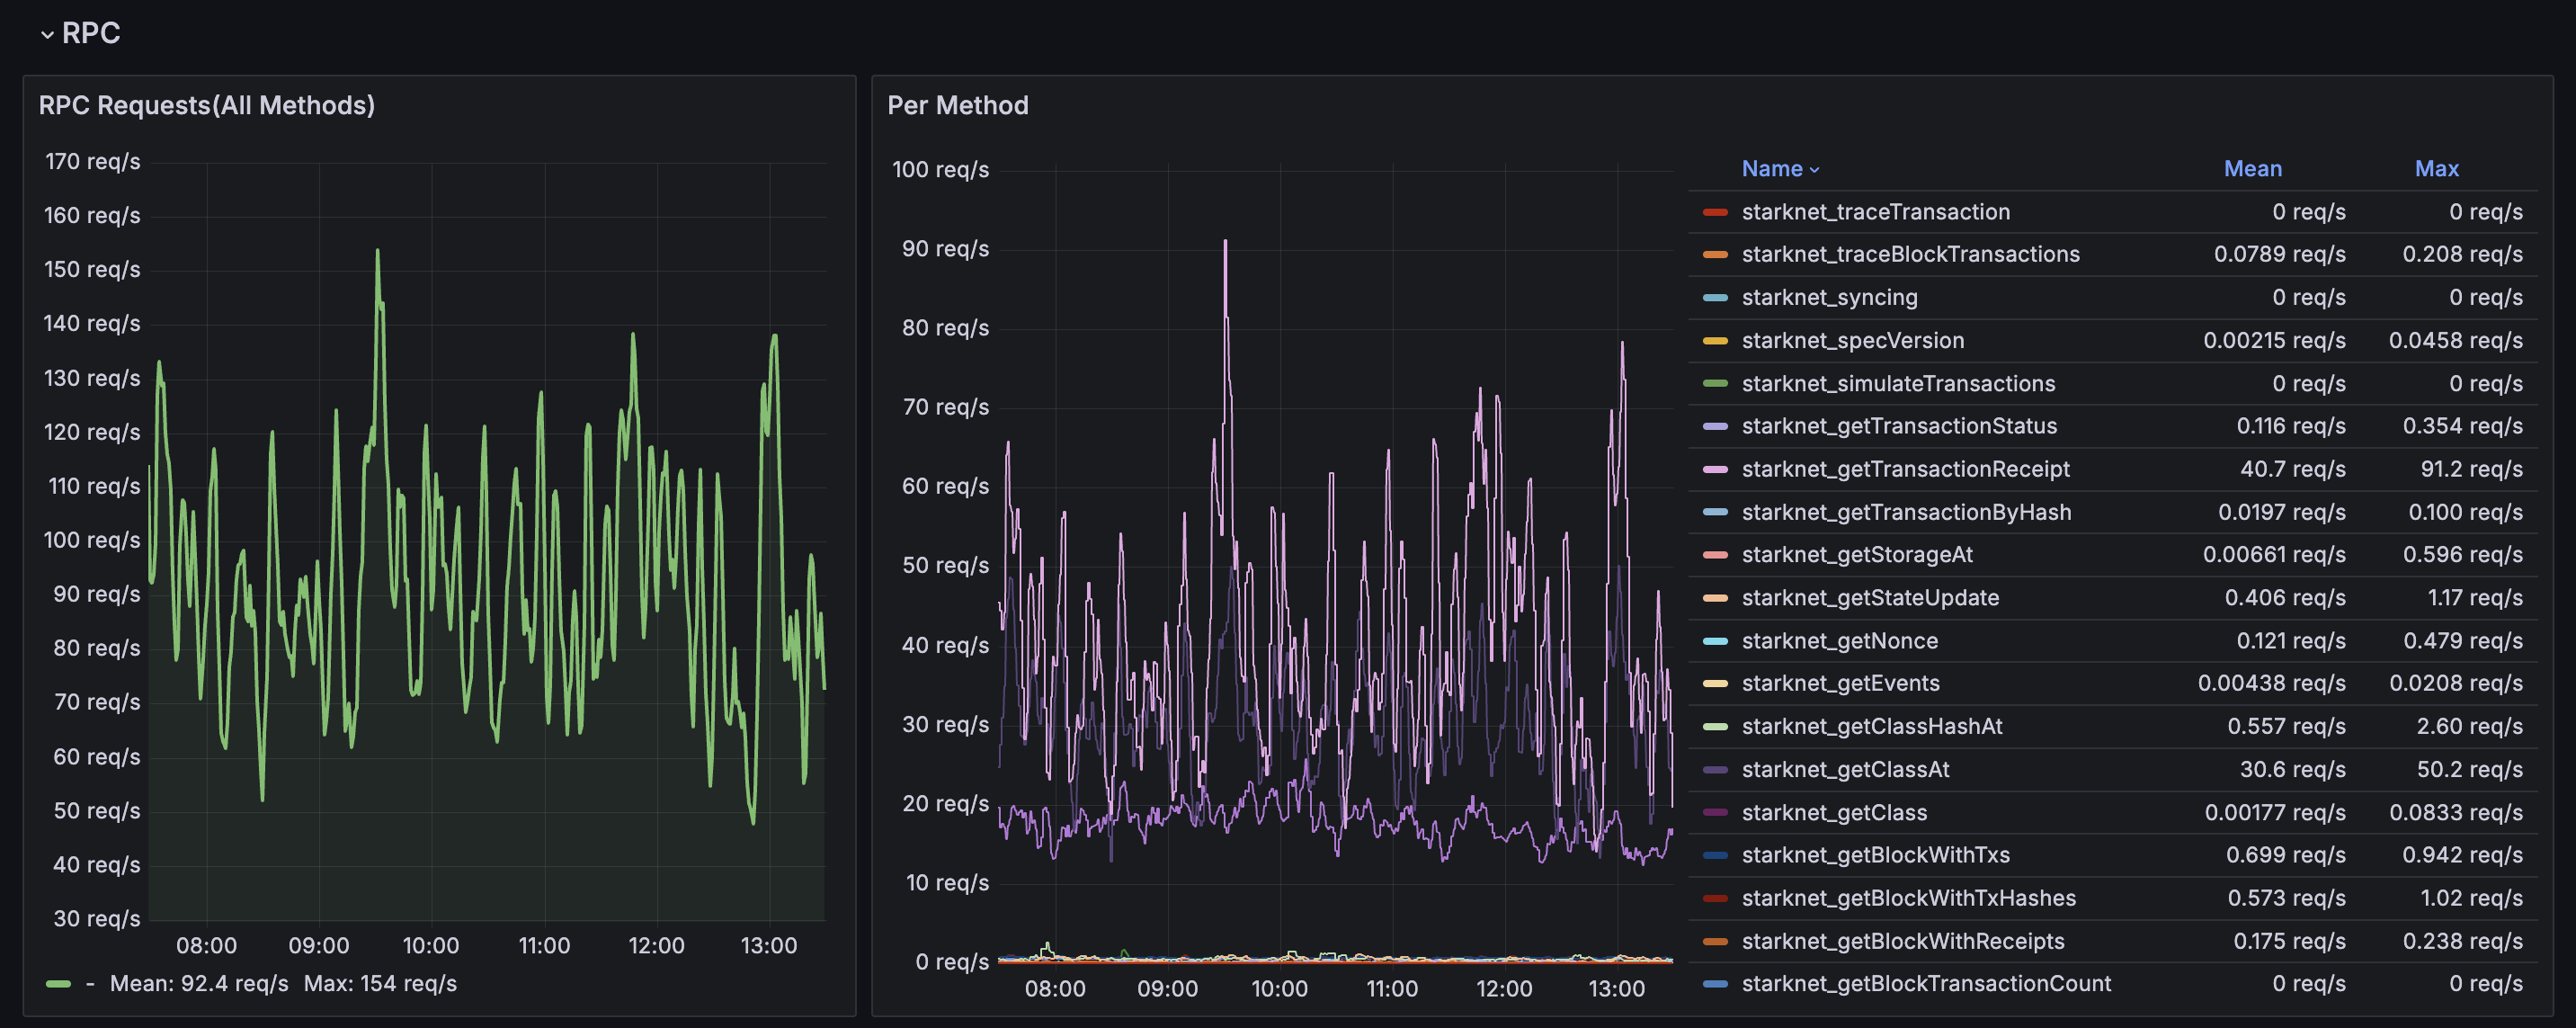
Juno uses Prometheus to monitor and collect metrics data, which you can visualise with Grafana. You can use these insights to understand what is happening when Juno is running.
Enable the metrics server
To enable the metrics server, use the following configuration options:
metrics: Enables the Prometheus metrics endpoint on the default port (disabled by default).metrics-host: The interface on which the Prometheus endpoint will listen for requests. If skipped, it defaults tolocalhost.metrics-port: The port on which the Prometheus endpoint will listen for requests. If skipped, it defaults to9090.
# Docker container
docker run -d \
  --name juno \
  -p 9090:9090 \
  nethermind/juno \
  --metrics \
  --metrics-port 9090 \
  --metrics-host 0.0.0.0 \
  --eth-node <YOUR-ETH-NODE>


# Standalone binary
./build/juno --metrics --metrics-port 9090 --metrics-host=0.0.0.0 --eth-node <YOUR-ETH-NODE>
Configure Grafana dashboard
The Juno Grafana dashboard is optimized for single-node deployments and uses generic metric selectors that work with standard Prometheus configurations.
1. Set up Grafana
- Follow the Set up Grafana guide to install Grafana.
- Download and configure the Grafana dashboard file.
2. Set up Prometheus
- Follow the First steps with Prometheus guide to install Prometheus.
- Add the Juno metrics endpoint in the
prometheus.ymlconfiguration file:
scrape_configs:
  - job_name: "juno"
    static_configs:
      - targets: ["localhost:9090"]
3. Set up Grafana Loki
- Follow the Get started with Grafana Loki guide to install Loki.
- Configure Loki to collect logs from Juno. You might need to configure log paths or use Promtail (Loki's agent) to send logs to Loki:
scrape_configs:
  - job_name: "juno-logs"
    labels:
      job: "juno"
      __path__: "/path/to/juno/logs/*"
To have Juno write logs to a file, use the command:
./build/juno >> /path/juno.log 2>&1
4. Configure the data sources
- Follow the Grafana data sources guide to add data sources.
- Choose Prometheus as a data source:
- Enter the URL where Prometheus is running, e.g.,
http://localhost:9090. - Click the "Save & Test" button.
- Choose Loki as a data source:
- Enter the URL where Loki is running, e.g.,
http://localhost:3100. - Click the "Save & Test" button.
Health endpoints for Kubernetes
Juno provides standard health endpoints that are designed to work with Kubernetes liveness and readiness probes:
/live endpoint
The /live endpoint always returns a 200 OK response to indicate that the Juno process is running. This endpoint is intended for use with Kubernetes livenessProbe to prevent unnecessary container restarts.
livenessProbe:
  httpGet:
    path: /live
    port: 6060
  initialDelaySeconds: 30
  periodSeconds: 10
/ready endpoint�
The /ready endpoint returns:
200 OKwhen the node is synced and ready to serve requests503 Service Unavailableduring migrations or when the node is not yet synced
This endpoint is intended for use with Kubernetes readinessProbe to control traffic routing.
readinessProbe:
  httpGet:
    path: /ready
    port: 6060
  initialDelaySeconds: 30
  periodSeconds: 5
  failureThreshold: 3
Configuring readiness criteria
You can configure what "synced" means for the /ready endpoint using the readiness-block-tolerance configuration option:
readiness-block-tolerance: Maximum blocks behind the latest block for the/readyendpoint to return200 OK(default:6)
# Example: Allow up to 10 blocks behind latest
./build/juno --readiness-block-tolerance 10 --http --http-port 6060
Complete Kubernetes deployment example
apiVersion: apps/v1
kind: Deployment
metadata:
  name: juno
spec:
  replicas: 1
  selector:
    matchLabels:
      app: juno
  template:
    metadata:
      labels:
        app: juno
    spec:
      containers:
      - name: juno
        image: nethermind/juno:latest
        ports:
        - containerPort: 6060
        args:
          - --http
          - --http-port=6060
          - --http-host=0.0.0.0
          - --readiness-block-tolerance=6
          - --eth-node=<YOUR-ETH-NODE>
        livenessProbe:
          httpGet:
            path: /live
            port: 6060
          initialDelaySeconds: 30
          periodSeconds: 10
        readinessProbe:
          httpGet:
            path: /ready
            port: 6060
          initialDelaySeconds: 30
          periodSeconds: 5
          failureThreshold: 3
Change log level in runtime
In case you want to change the log level in runtime without the need to restart the juno process, you can do it via HTTP calls.
To enable this feature, use the following configuration options:
log-host: The interface to listen for requests. Defaults tolocalhost.log-port: The port to listen for requests. REQUIRED
Examples:
# Start juno specifying the log port
juno --log-port=6789 --log-level=error ...

# Get current level
curl -X GET 'localhost:6789/log/level'
error

# Set level
curl -X PUT 'localhost:6789/log/level?level=trace'
Replaced log level with 'trace' successfully

# Get new level
curl -X GET 'localhost:6789/log/level'
trace